The ability to plot your data clearly and efficiently is vitally important. Plotting is one of the most common means through which significant aspects of a mining project are communicated to stakeholders. However, having the ability to readily generate professional-grade plots for printing and/or publishing is an often-overlooked topic when end-users are evaluating General Mine Planning (GMP) software.
If you have ever had to deal with inadequate plotting tools, you will know the process can be a tricky and painful undertaking which can often result in sub-standard results.
Good news – at MICROMINE we have you covered! Our industry-leading plotting tools make plotting a breeze, whether you wish to quickly plot what you currently see on screen, or you wish to repeatedly batch plot a series of sections each time new data is received. The Micromine Plot Editor is an integrated environment for configuring presentation-quality output every time.
Plot Editor
The Plot Editor is where you create plot layouts of your project data and then publish them to a file (e.g. PDF) or print to a plotter or other hard-copy output device. Plot layouts may be as simple or as complex as you need, with multiple frames incorporating other plots, coordinate grids, legends, images, tables, and more.
You work within the Plot Editor window whenever you interact with a plot layout. This window provides a separate interactive environment similar to Vizex (Micromine’s graphic environment used to display, edit and interact with all MIcromine data types) and like Vizex, the Plot Editor window includes relevant toolbars and a set of docking windows through which you interact with your plot data.
Scaling and Positioning Data
The plot scale is defined in the Properties window. Changing the scale is as simple as entering the desired value(s) e.g. entering a value of 1000 for a metric plot will result in a scale of 1:1000. Depending on the plot layout, the X-Scale and Y-Scale may be controlled independently in which case both will need to be defined.
With the correct scale applied, the data can be positioned interactively by panning/rotating within the plot frame. Alternatively, you can accurately position the data by entering known values for the coordinate point that you wish to be located at the centre of the plot frame.
Frames
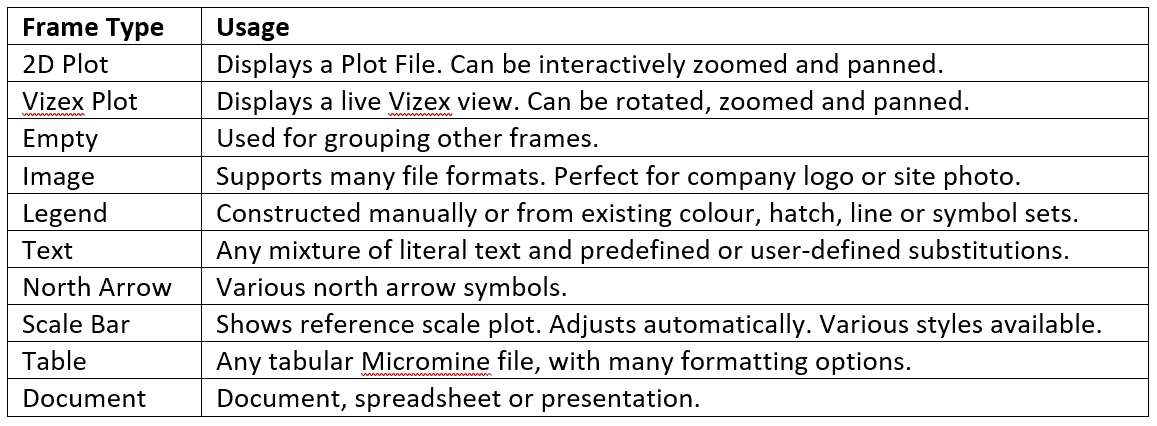
The rectangular boxes on a plot layout are called frames, and the plot frame is simply the one containing the plot data. Depending on the layout, you may have multiple plot frames. Other frames might contain title text, a scale bar, a legend, or a company logo.
Modifications to a plot layout can be as broad as applying a completely new template, or as subtle as changing the properties of a single plot frame. Micromine includes a variety of pre-defined layout templates and plot forms (predefined frame properties) to speed up both processes.
Coordinate Grids
A coordinate grid overlay can be applied to your plots. It is easy to format a coordinate grid overlay in a variety of different ways, incorporating elements such as major and minor gridlines, labels, spacing, line styles, etc.
Labels
Sometimes you may need to edit, reposition, or add labels on a layout. There are many reasons for altering labels, some of which are to:
- Resolve overlapping labels by aligning, moving, resizing, or rotating one or more of them
- Clarify or enhance information by editing label text
- Highlight specific areas by placing additional labels (callouts)
Once the plot frame which the labels are applicable to is selected, adding or editing existing labels is easily achieved by clicking on the respective icons in the toolbar. Drag and drop functionality makes repositioning labels in a more suitable location a simple process.
Macros
Micromine includes many individual tools and functions. Often these are combined into a workflow, which may be repeated time and again. In such cases, it is recommended that you save the form sets (parameters) used for each step and incorporate them into a macro, which can be re-run when required and in doing so saves time for other tasks and reduces the likelihood of human error.
Plotting is no exception, and the process of plotting data across multiple sections is a classic scenario that benefits from automation. Automating the Plot Editor makes it easy to send multiple plots, such as drill sections at the end of a drilling programme, to an output device without having to sit at your computer and generate each one manually.
This article presents a high-level introduction to the Micromine Plot Editor which enables a simple, repeatable and efficient plotting workflow that generates suitable output for all your plotting needs. With its intuitive interface, unaccustomed users will learn very quickly how to navigate the plentiful customisation options available and will be wowing your colleagues in no time with your professional-looking results.
If you wish to know more about Micromine plotting tools, or any other offerings in our product range, please contact your local Micromine office for further information.


